> For the complete documentation index, see [llms.txt](https://docs.balkan.id/llms.txt). Markdown versions of documentation pages are available by appending `.md` to page URLs; this page is available as [Markdown](https://docs.balkan.id/iam-risk-analyzer/risk-analysis-dashboard.md).
# Risk Analysis Dashboard
The **Risk Analysis Dashboard** provides a centralized view of your organization's identity hygiene and access posture for a selected integration. The dashboard surfaces risk, tracks action items, and monitors entitlement activity so teams can easily identify security issues.
### Summary Tiles: Posture Overview
Summary tiles provide an immediate, high-level measure of the access landscape. These metrics highlight critical identity and access issues at a glance:
* **Orphan Identities:** Active identities mapped to terminated employees.
* **Unused Access (90+ Days):** Identities that have not utilized any of their assigned permissions in the last 90 days.
* **Dormant Accounts (180+ Days):** Identities that have not logged in or performed any actions for over six months.
* **Never Logged In:** Accounts that have been provisioned but never utilized.
* **Empty Groups:** Groups containing zero active members.
* **Single-Identity Groups:** Groups containing only one user (ideal candidates for cleanup).
* **No Access Identities:** Active identities within the integration that hold zero access permissions.
* **Over-Provisioned Identities:** Active identities holding an excessively high number of access permissions (typically > 50).
### Priority Action Items
The priority section categorizes tasks into three severity-based lists. This structure ensures that teams can easily focus their efforts on the highest-impact work first.
* **P1: Critical Risks** – High-severity violations requiring immediate attention.
* **P2: Operational Cleanup** – Moderate-severity risks affecting the principle of least privilege.
* **P3: Housekeeping** – Routine governance hygiene and configuration optimization.
#### Investigating Findings
Each priority issue includes a category label and a brief risk summary.
To take action on an issue, click the **Investigate** (redirection arrow) icon. This opens a new tab and routes you directly to the relevant Identities list or Connections page. The destination page is automatically pre-filtered to isolate the specific users or groups contributing to that risk item, allowing for immediate review and correction.
### Analytics & Access Insights
* **Group/Team Connection Distribution:** Tracks the total number of groups assigned per identity to highlight users holding disproportionately high access.
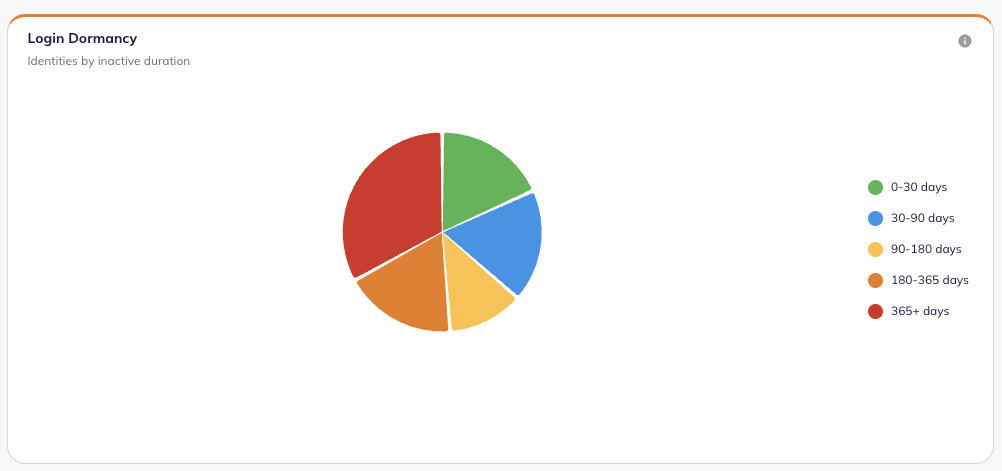
* **Login Dormancy Breakdown:** Categorizes inactive identities by specific duration tiers.
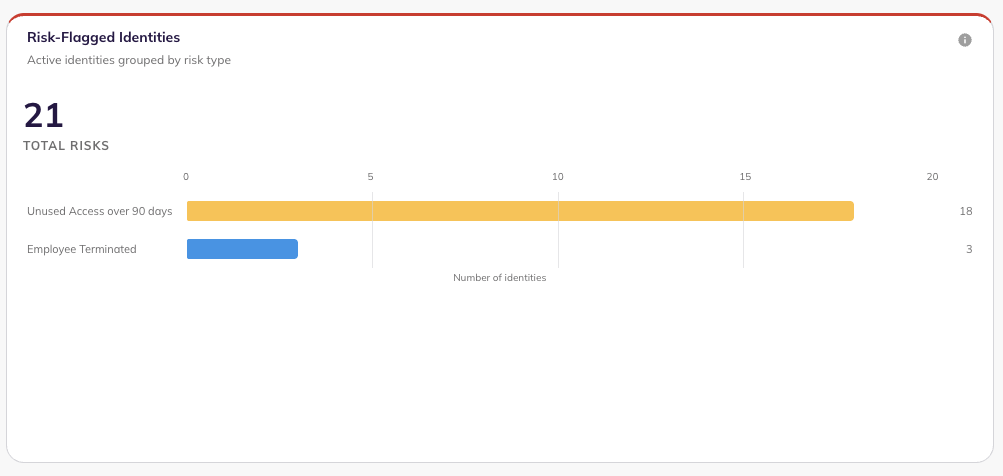
* **Risk-Flagged Identities:** Groups active identities flagged for risky insights, such as overprivileged access, unused access or SoD violations.
* **Direct Access Identities:** Displays resources that are being accessed directly rather than through connection assignments.
* **Identical Access Clusters:** Identifies different groups that share identical memberships, serving as prime candidates for consolidation.
* **Groups Reduction Path:** Provides a step-by-step projection of how your total group count decreases as you perform various cleanup actions. It maps out your potential path toward a leaner, more secure access architecture by eliminating redundant and underutilized groups.
### Ranked Insights
These ranked lists highlight broad access issues and track direct-grant behaviors across the organization.
* **Managers by Unused Team Access:** Ranks managers whose respective teams hold the highest volume of stale or unused permissions.
* **Managers by Direct Team Grants:** Ranks managers who frequently bypass standard roles by assigning permissions directly to their team members.
* **Users by Direct Resources:** Highlights specific individuals who hold the highest volume of direct, non-role resource assignments.
---
# Agent Instructions
This documentation is published with GitBook. GitBook is the documentation platform designed so that both humans and AI agents can read, navigate, and reason over technical content effectively. Learn more at gitbook.com.
## Querying This Documentation
If you need additional information that is not directly available in this page, you can query the documentation dynamically by asking a question.
Perform an HTTP GET request on the current page URL with the `ask` query parameter, and the optional `goal` query parameter:
```
GET https://docs.balkan.id/iam-risk-analyzer/risk-analysis-dashboard.md?ask=&goal=
```
`ask` is the immediate question: it should be specific, self-contained, and written in natural language.
`goal` is optional and describes the broader end goal you are ultimately trying to accomplish on behalf of the user. GitBook uses it to tailor the answer towards what is most useful for that goal.
The response will contain a direct answer to the question and relevant excerpts and sources from the documentation.
Use this mechanism when the answer is not explicitly present in the current page, you need clarification or additional context, or you want to retrieve related documentation sections.